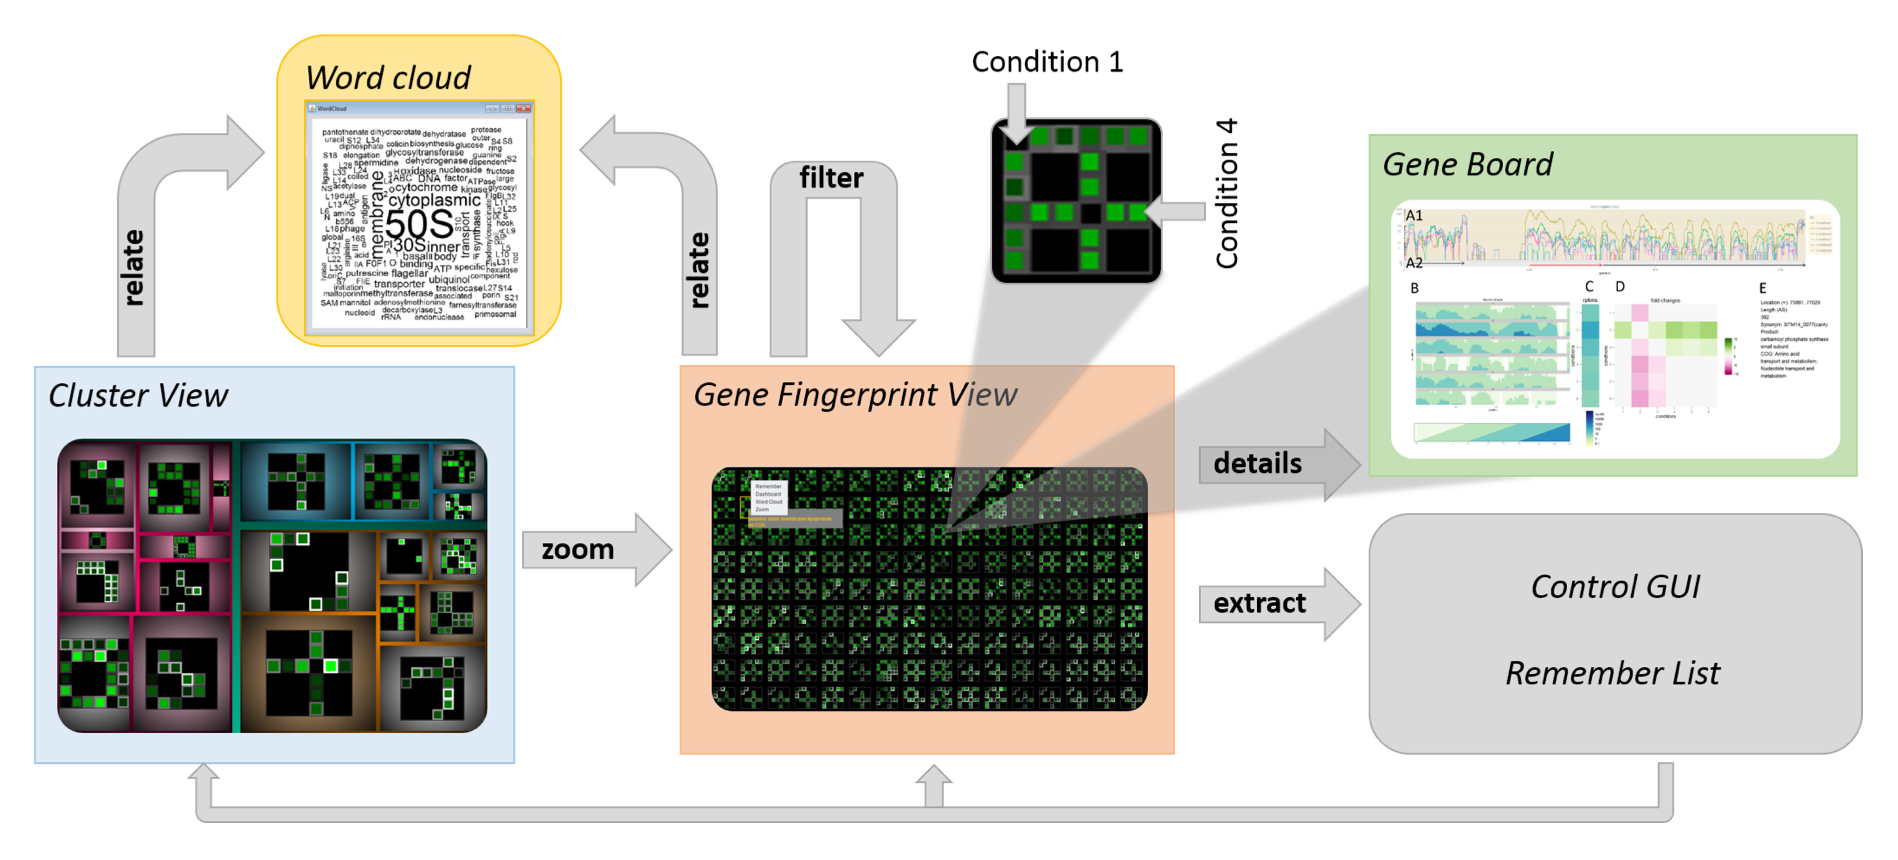
 Schematic work flow of the three views in VisExpress: Cluster View, Gene Fingerprint View, Gene Board.
Abstract
Biologists are keen to understand how processes in cells react to environmental changes. Differential gene expression analysis allows biologists to explore functions of genes with data generated from different environments. However, these data and analysis lead to unique challenges since tasks are ill-defined, require implicit domain knowledge, comprise large volumes of data, and are, therefore, of explanatory nature. To investigate a scalable visualization-based solution, we conducted a design study with three biologists specialized in differential gene expression analysis. We stress our contributions in three aspects: first, we characterize the problem domain for exploring differential gene expression data and derive task abstractions and design requirements. Second, we investigate the design space and present an interactive visualization system, called VisExpress. Third, we evaluate the usefulness of VisExpress via a Pair Analytics study with real users and real data and report on insights that were gained by our experts with VisExpress.